There are many ways football analysts can describe a player.
He's a high energy player...hits with a lot of force...has exceptional power…puts in the work. For the most part we all understand what is meant when these types of words are used to describe some physical attribute of a player. However, in the world of physics each of the words I used above has a specific meaning and, you guessed it, a formula. This is going to dive into what is sometimes referred to as Newtonian (or Classical) Mechanics, which looks at how forces applied to objects create and influence motion. This is, of course, named after Sir Isaac Newton, the founder of gravity and partially credited with inventing calculus (I'm team Leibniz, but that's maybe for a later time). You may have heard of Newton's Three Laws of Motion - that's what we're going to explore here and relate the mechanics of motion to the NFL combine.
Speed/velocity: Distance traveled over time (miles per hour, feet per second, or meters per second)
Mass: The amount of matter or "stuff" an object is composed of which gives resistance to motion. Mass isn't exactly the same as weight, but they're directly related through the constant pull of gravity. A person’s weight is their mass times the influence of gravity. As an equation, Weight = mass * gravity
Now onto the main concepts we are going to discuss: energy, work, and power. Putting an object in motion by applying a force to it requires energy, and this energy does work to move the object. The concepts or energy and work are similar enough for our purposes and both have the same unit of measure (Joules). The gist is energy is transferred to do work. Power is the rate in which work is done or energy is transferred. Since the unit of energy is Joules, power is Joules per second, which is called a Watt (not JJ, TJ, nor Derek, but James). Outside of lightbulbs and electricity, we aren't used to using the Watt as a unit of measurement so we can convert this to horsepower which is also a measure of power just scaled differently (around 746 Watts is 1 Horsepower).
We are going to look at two activities from the combine and put a new spin on those measurements: The 40 yard dash, where we will calculate average power output, and the vertical jump calculating energy/work. I put a couple of example calculations at the end of the post if you’re interested in taking a look. Using data from Pro Football Reference going back to the 2000 combine, here are the players with the highest output by position:
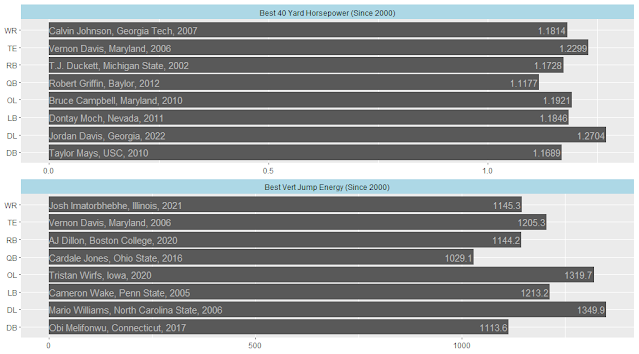
So how do we interpret this? Bruce Campbell (OL) and Dontay Moch (LB) had essentially the same power output in the 40yd dash (1.192 and 1.1846 hp, respectively). Moch ran 0.35 seconds faster, but he is outweighed by Campbell by 66 pounds and that extra mass, despite running much slower actually gives Campbell slightly more horsepower. Similarly with the vertical jump, Tristan Wirfs and Mario Williams produced close to the same amount of energy (1,319.7 and 1,349.9 Joules), with Williams out-jumping Wirfs by 4 inches but weighing 25 pounds less.
A couple of notes, the position groups are pretty vague (e.g. DL includes both edge rushers and interior linemen since they were not consistently labeled on the data). Also, 40 yard power and vertical jump energy together do not paint a complete athletic picture as they fail to consider things like change of direction and agility, but they do show which players fair well with unidirectional movement. I would be comfortable calling players with high power and energy metrics “explosive.”
As always, I put this data into dashboards that you can explore. There you'll see that Jordan Davis is a beast, Vernon Davis demolished all other TEs, and defensive linemen are the most explosive position group. It’s also interesting to see who’s on the other end of this spectrum. I don’t want to spoil it, but the least explosive player just unretired in Florida. In the dashboard I also compare how these kinetic values of power and energy differentiate for combine participants that end up getting drafted to those that do not.
Click here to go to my Tableau Dashboard!
Tweet to @MathWithJerome Follow @MathWithJerome
40 Yard Dash Energy (Work) = ½ * m * v²
40 Yard Dash Power in Watts = Energy/t
He's a high energy player...hits with a lot of force...has exceptional power…puts in the work. For the most part we all understand what is meant when these types of words are used to describe some physical attribute of a player. However, in the world of physics each of the words I used above has a specific meaning and, you guessed it, a formula. This is going to dive into what is sometimes referred to as Newtonian (or Classical) Mechanics, which looks at how forces applied to objects create and influence motion. This is, of course, named after Sir Isaac Newton, the founder of gravity and partially credited with inventing calculus (I'm team Leibniz, but that's maybe for a later time). You may have heard of Newton's Three Laws of Motion - that's what we're going to explore here and relate the mechanics of motion to the NFL combine.
 |
| Newton discovering gravity by getting donked in the head by an apple |
Why take a look at combine data in this way?
At the 2022 Combine Jordan Davis, who weighs 341 pounds, ran 40 yards in 4.78 seconds and folks all around the NFL were stunned. The NFL used the eye screaming face emoji in a tweet. People were shocked that someone so big moved so fast. Check out the NFL Network's reaction:Jordan Davis ran 4.78 weighing 341lbs; Tristan Wirfs ran 4.85 weighing 320lbs; Calvin Johnson ran 4.35 weighing 239lbs; Taylor Mays ran 4.31 weighing 230lbs. All of these are extremely impressive but since we have to rank and debate everything -- which is the most impressive? How about Wirf’s vertical jump of 36.5 inches compared to Mario Williams jumping 40.5 inches weighing 290lbs? That’s where understanding combine events from a physics perspective can help.BIG MAN MOVIN.@GeorgiaFootball DL @jordanxdavis99 with an UNREAL 4.82u at 341 lbs. 😱
— NFL (@NFL) March 5, 2022
📺: #NFLCombine on @nflnetwork pic.twitter.com/aEVRSssbOC
The key concepts
A quick review of some things to keep in mind:Speed/velocity: Distance traveled over time (miles per hour, feet per second, or meters per second)
Mass: The amount of matter or "stuff" an object is composed of which gives resistance to motion. Mass isn't exactly the same as weight, but they're directly related through the constant pull of gravity. A person’s weight is their mass times the influence of gravity. As an equation, Weight = mass * gravity
Now onto the main concepts we are going to discuss: energy, work, and power. Putting an object in motion by applying a force to it requires energy, and this energy does work to move the object. The concepts or energy and work are similar enough for our purposes and both have the same unit of measure (Joules). The gist is energy is transferred to do work. Power is the rate in which work is done or energy is transferred. Since the unit of energy is Joules, power is Joules per second, which is called a Watt (not JJ, TJ, nor Derek, but James). Outside of lightbulbs and electricity, we aren't used to using the Watt as a unit of measurement so we can convert this to horsepower which is also a measure of power just scaled differently (around 746 Watts is 1 Horsepower).
 |
| Magnus Samuelsson doing A LOT of work right here |
Physics of NFL combine events
So how does this relate to football players running and jumping? Heavier players have more mass, which means more energy is needed to do work, e.g. running 40 yards. We can apply the concepts of energy, work, and power to more concisely characterize how a prospect tests during a combine event.We are going to look at two activities from the combine and put a new spin on those measurements: The 40 yard dash, where we will calculate average power output, and the vertical jump calculating energy/work. I put a couple of example calculations at the end of the post if you’re interested in taking a look. Using data from Pro Football Reference going back to the 2000 combine, here are the players with the highest output by position:
A couple of notes, the position groups are pretty vague (e.g. DL includes both edge rushers and interior linemen since they were not consistently labeled on the data). Also, 40 yard power and vertical jump energy together do not paint a complete athletic picture as they fail to consider things like change of direction and agility, but they do show which players fair well with unidirectional movement. I would be comfortable calling players with high power and energy metrics “explosive.”
As always, I put this data into dashboards that you can explore. There you'll see that Jordan Davis is a beast, Vernon Davis demolished all other TEs, and defensive linemen are the most explosive position group. It’s also interesting to see who’s on the other end of this spectrum. I don’t want to spoil it, but the least explosive player just unretired in Florida. In the dashboard I also compare how these kinetic values of power and energy differentiate for combine participants that end up getting drafted to those that do not.
Click here to go to my Tableau Dashboard!
Tweet to @MathWithJerome Follow @MathWithJerome
Formulas used and example calculations
m = mass, v = velocity, t = time, w = weight, d = distance40 Yard Dash Energy (Work) = ½ * m * v²
40 Yard Dash Power in Watts = Energy/t
40 Yard Dash Horsepower = 40 Yard Dash Power in Watts/745.7
Vertical Jump Energy (Work) = w * d
In 2006 Vernon Davis (TE) weighed 254lbs, ran the 40 yard dash in 4.38 seconds, and jumped 42 inches in the vertical. First, we are going to convert units to metric (pounds to kg, yards to meters). To find his mass, we convert lbs to kilograms.
254 lbs → 115.2 kg (mass)
40yds → 36.58 meters
Velocity, v = 36.58/4.38 = 8.35 meters/sec
Davis’ 40 Yd Energy = ½ * 115.2 * 8.35² = 4,016.016 Joules
Davis’ 40 Yd Power = Energy/time = 4,016.016/4.38 = 916.9 Watts
Davis’ 40 Yd Horsepower = 916.9/745.7 = 1.23 Horsepower
42 inches → 1.067 meters
42 inches → 1.067 meters
Remember that w = m * g, where g accounts for gravity (and g = 9.80665)
Vertical Jump Energy (Work) = 115.2 * 1.067 * 9.80665 = 1,205.83 Joules
Vertical Jump Energy (Work) = 115.2 * 1.067 * 9.80665 = 1,205.83 Joules